Grant tools unified into one trusted platform
Overview
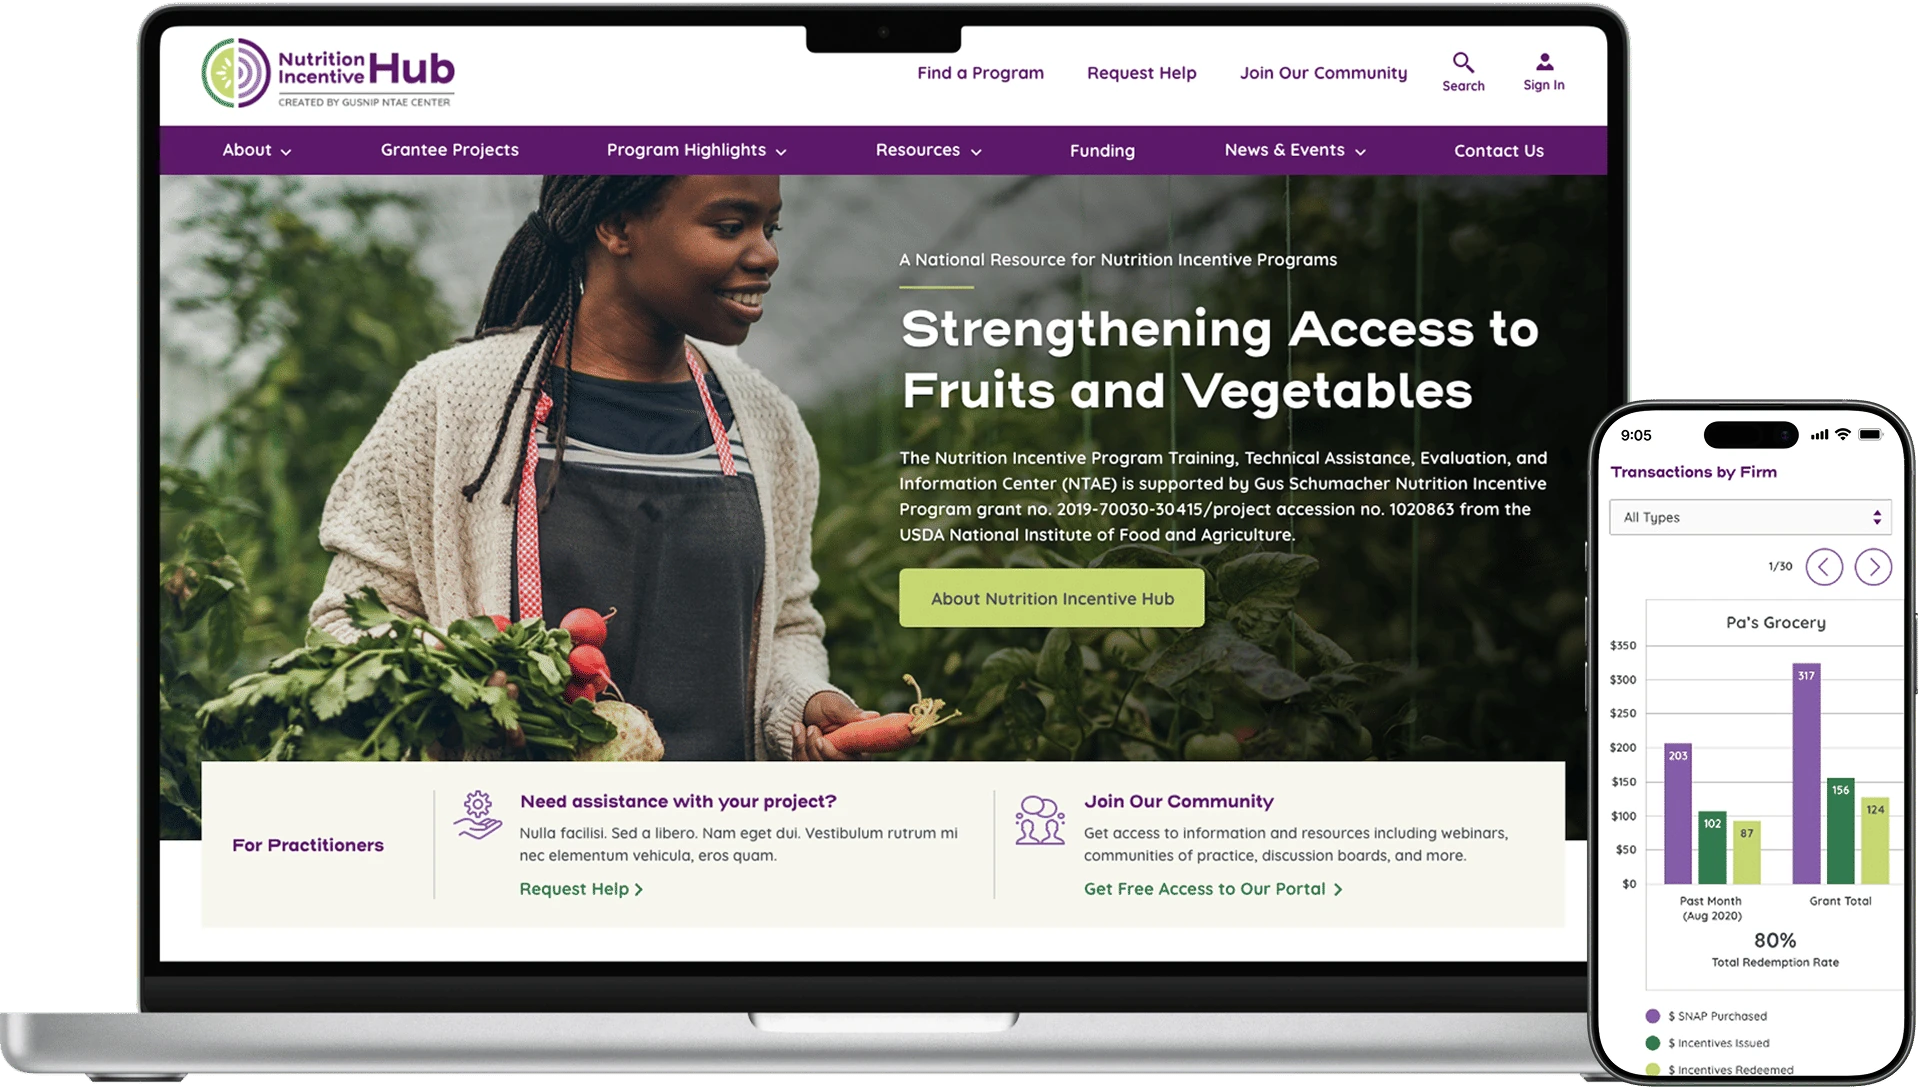
Nutrition Incentive Hub
A USDA-backed coalition supporting nutrition incentive and produce prescription projects. It connects practitioners, researchers, and program administrators to build stronger, more effective programs. Those programs put healthy food on the tables of families who need it most.
The problem
The network ran on old software, spreadsheets, and workarounds. No two of them agreed. Grantees spent more time chasing paperwork than running their programs. The administrators helping them spent their days on that same paperwork. They had no way to tell which programs were actually working.
The solution
I led the design of one portal and Power BI platform to replace all of it. Accessibility (WCAG 2.1 AA) and a documented design system were built in from the start. Instead of hunting for the current version of something, grantees and administrators could open one place and trust what they found there.
My approach
Research-led product design for a federal coalition
The path from talking to people and mapping their days to a working portal, accessibility standards, and a documented design system.
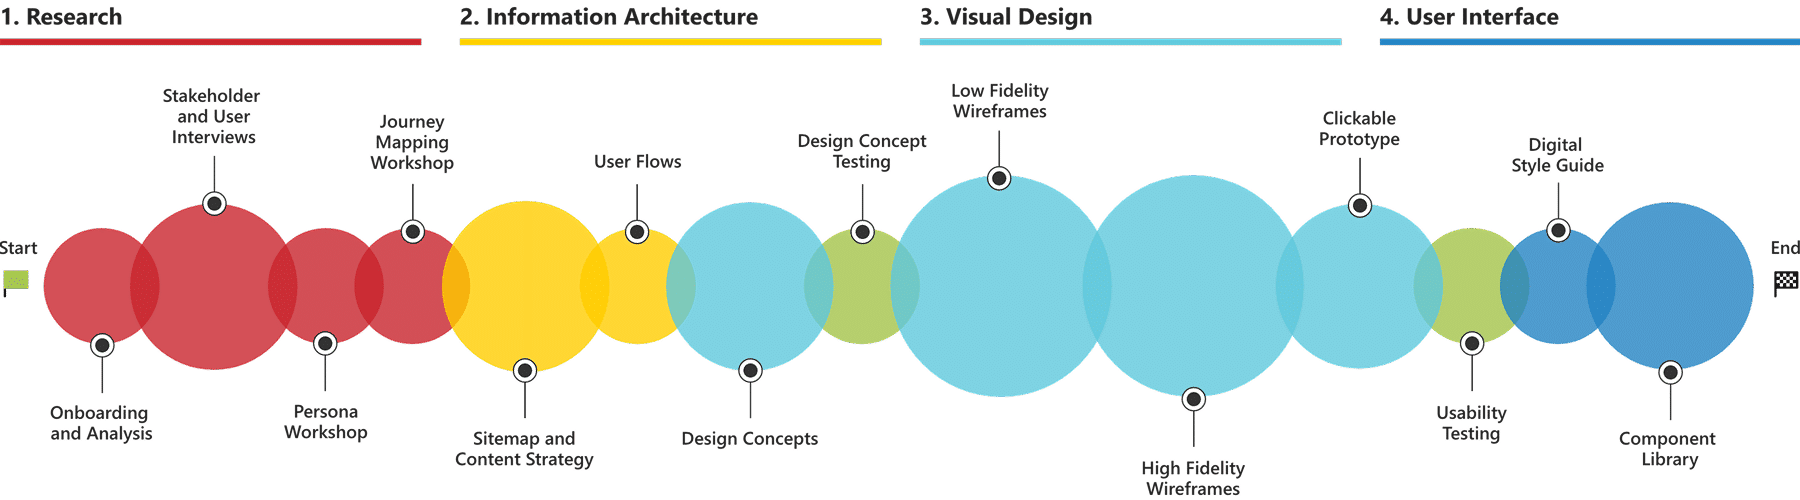
Size of circle = Amount of effort
Research
Before designing anything, we needed to understand where the friction actually lived. We paired a system audit with stakeholder interviews and journey mapping to capture how grantees, administrators, and researchers experienced the network day to day. The data told us what was slow. The interviews told us what was stressful. The two rarely pointed at the same thing.
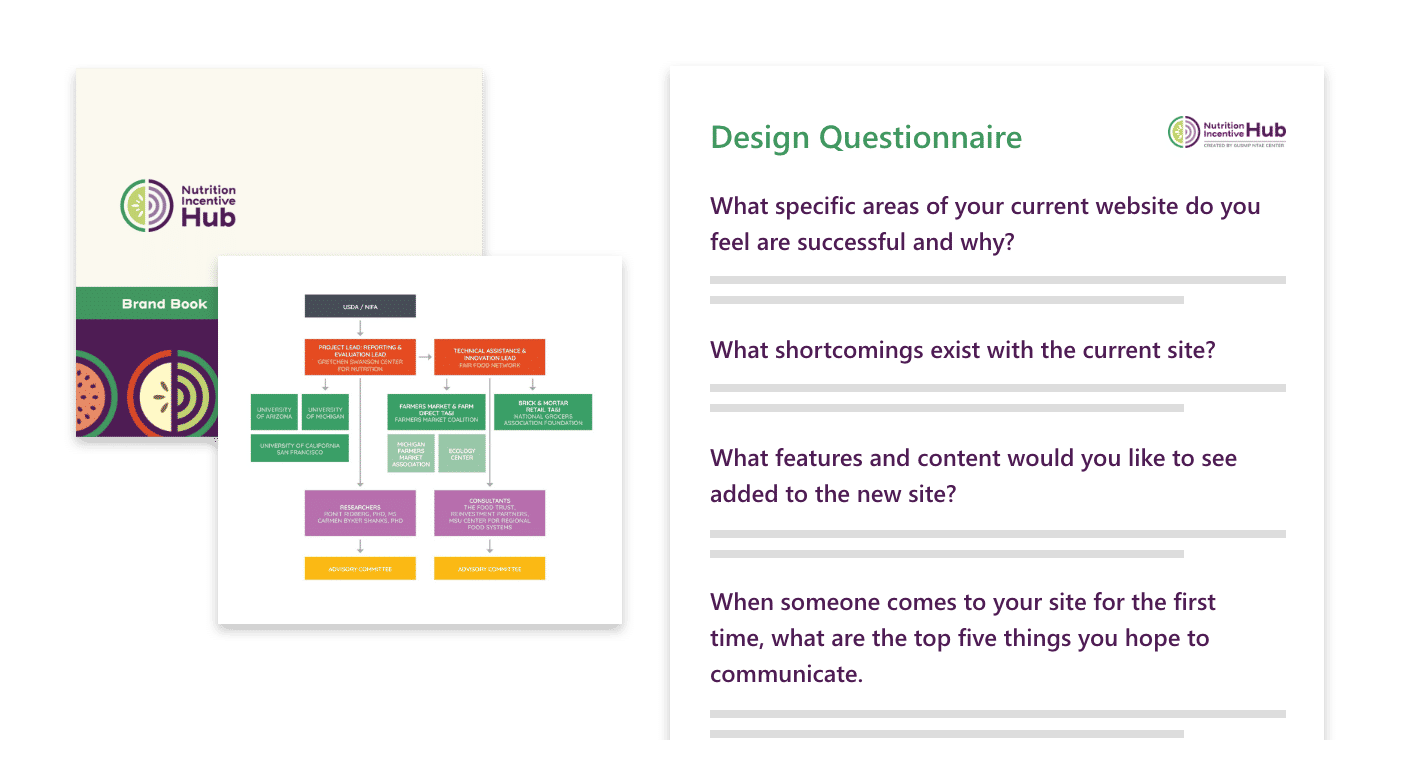
System audit & analysis
- Found where the spreadsheets slowed everyone down
- Matched federal reporting rules to what the system could do
- Documented every tool in use, to replace the paper trail
Stakeholder inquiry
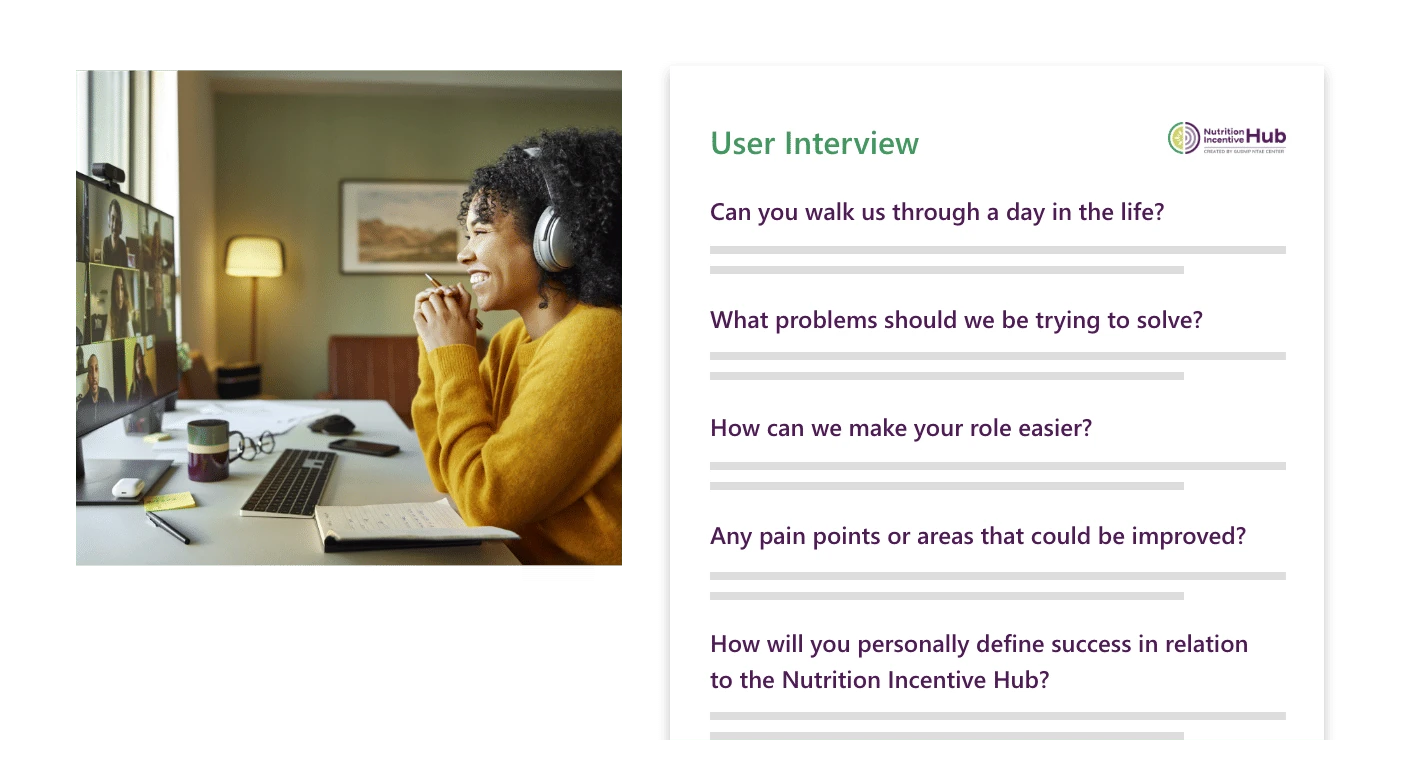
- Interviewed users to find what wore them down
- Made the case for one live portal
- Found where people got lost while applying
Persona development
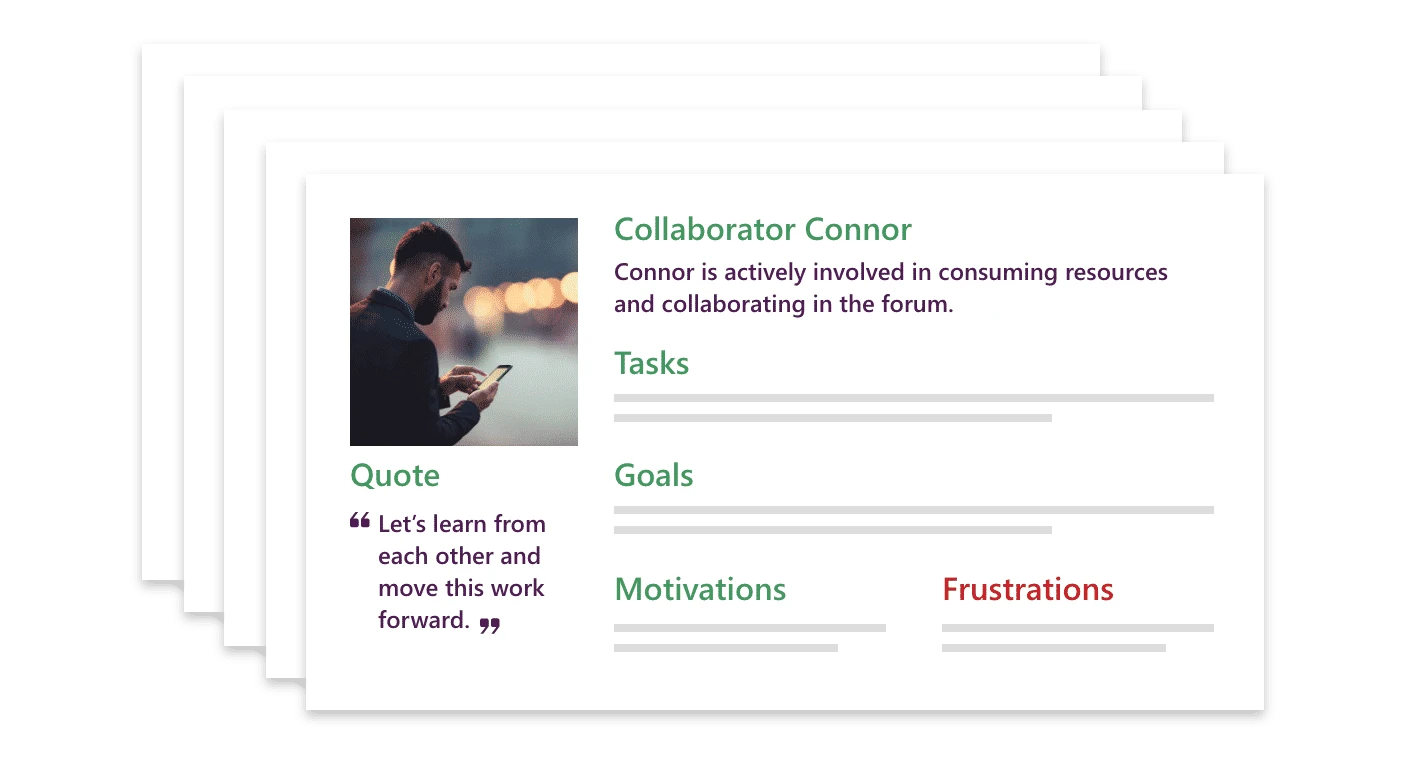
- Built personas for every kind of user
- Named the groups having the hardest time
- Gave developers real people to build for
Journey mapping
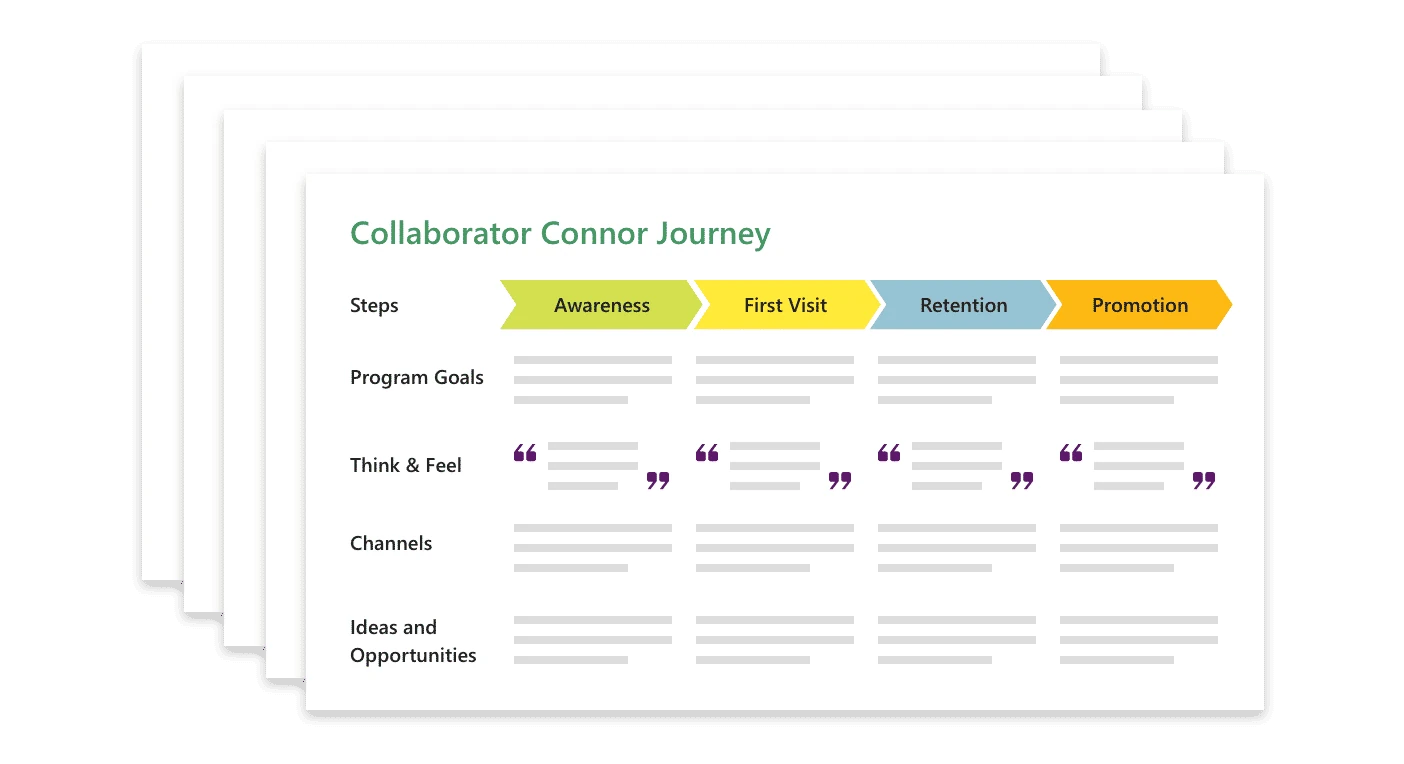
- Mapped the trip from applying to getting funded
- Marked the moments people got confused
- Added help where people needed it most
Information architecture
A coalition this size accumulates content faster than anyone can organize it. We restructured the information around how people actually look for things, not how the organization happened to be filed. The goal was simple. Anyone, from a first-time grantee to a seasoned administrator, should be able to find what they need without already knowing where it lives.
Strategic content org
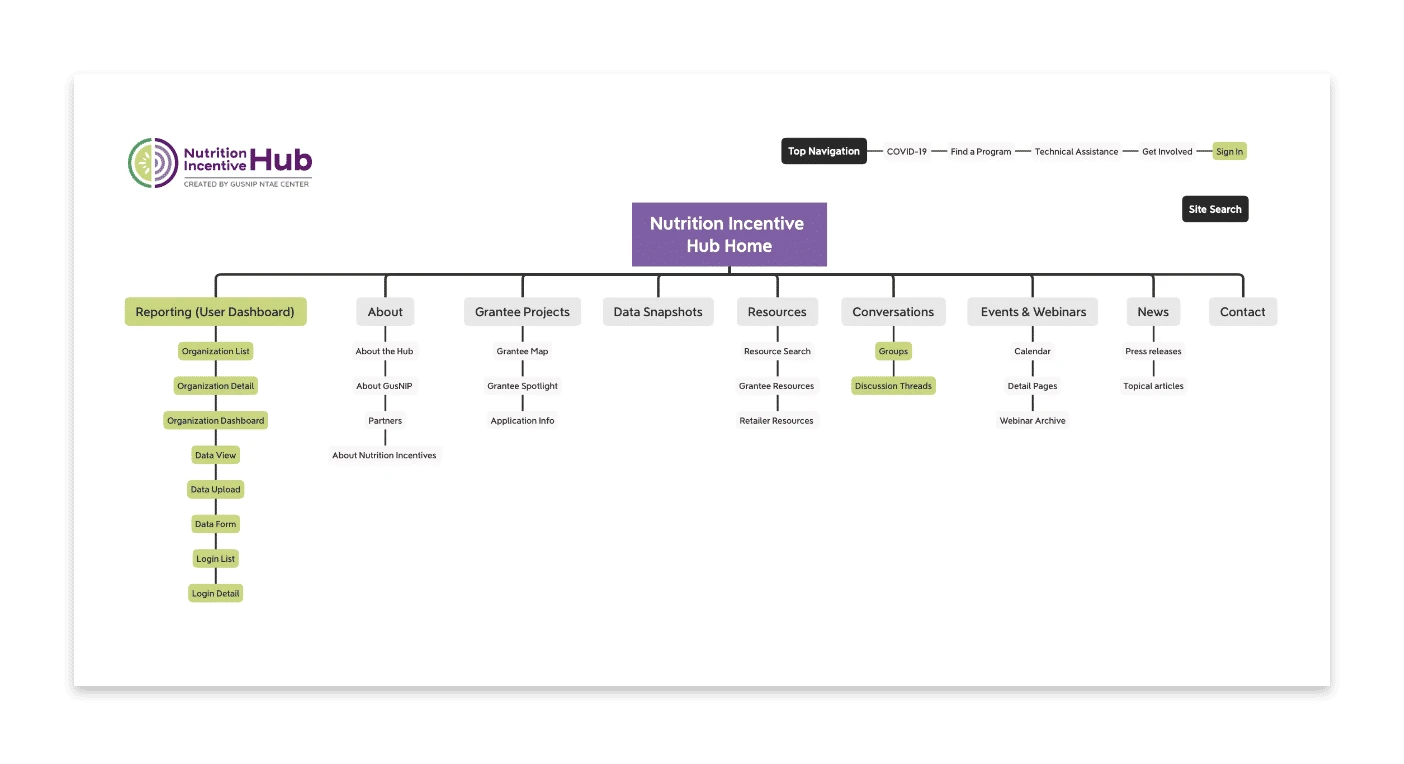
- Renamed things the way people actually say them
- Put every resource within two clicks
- Built room for the network to keep growing
Workflow optimization
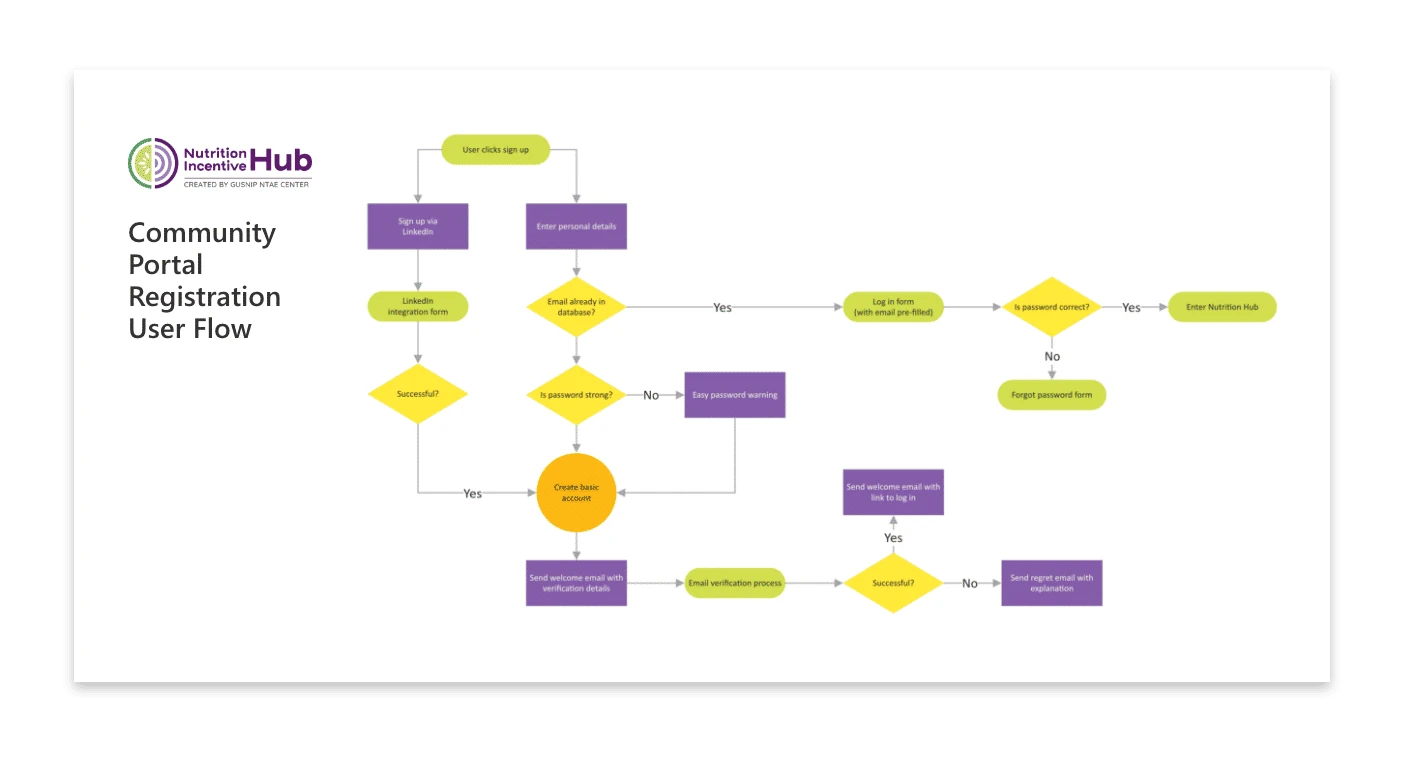
- Reduced processing time from 45-55 hours to just over 10
- Mapped the decision paths so no one hit a dead end
- Connected what grantees submit to what reviewers see
Visual design
Public-sector tools often feel cold, and that coldness quietly tells people the system wasn’t built for them. We developed a visual language that balanced the authority a federal program requires with the warmth its community deserves. Consistency here wasn’t about looking polished. It was about making the platform feel trustworthy and calm under the weight of real work.
Conceptual exploration
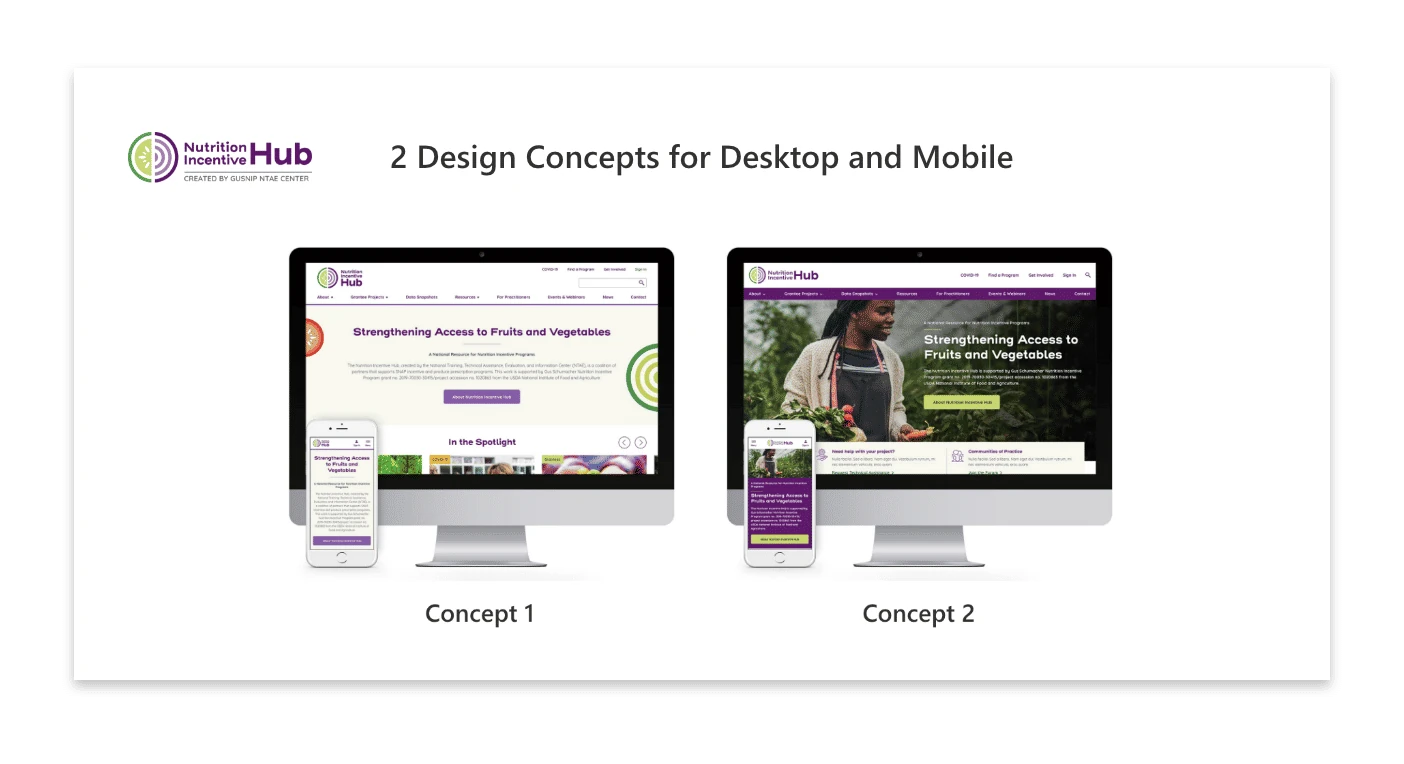
- Balanced federal authority with a human feel
- Tried directions that met the rules and still felt usable
Prototyping & validation
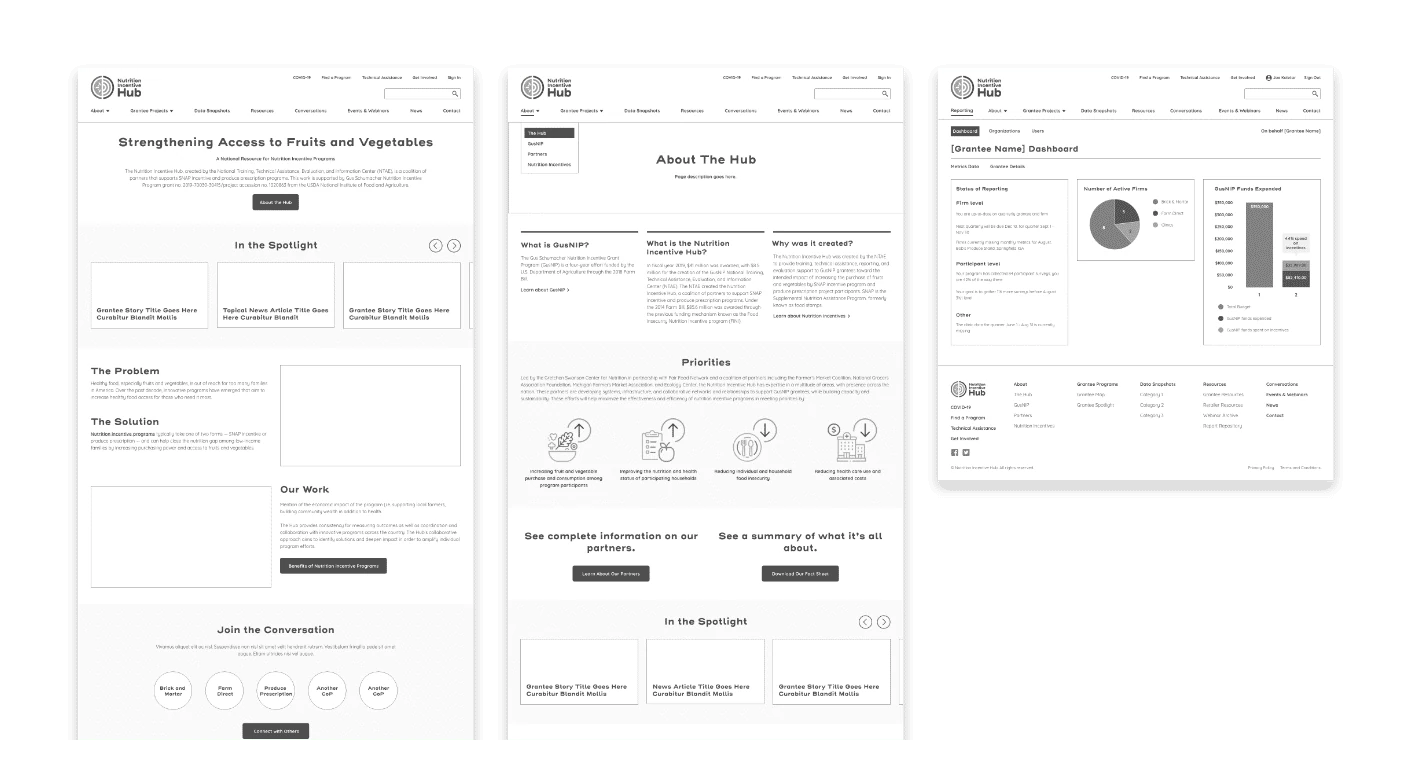
- Tested assumptions on rough screens first
- Applied WCAG standards from the first draft
- Filled out the forms ourselves to find the errors
User interface
The last layer was making the system durable. We built a component library and design system so the platform could grow without fragmenting again. Every pattern was documented, checked against WCAG 2.1 AA, and handed to the development team ready to use. That way the clarity we designed would outlast the launch.
Digital design system
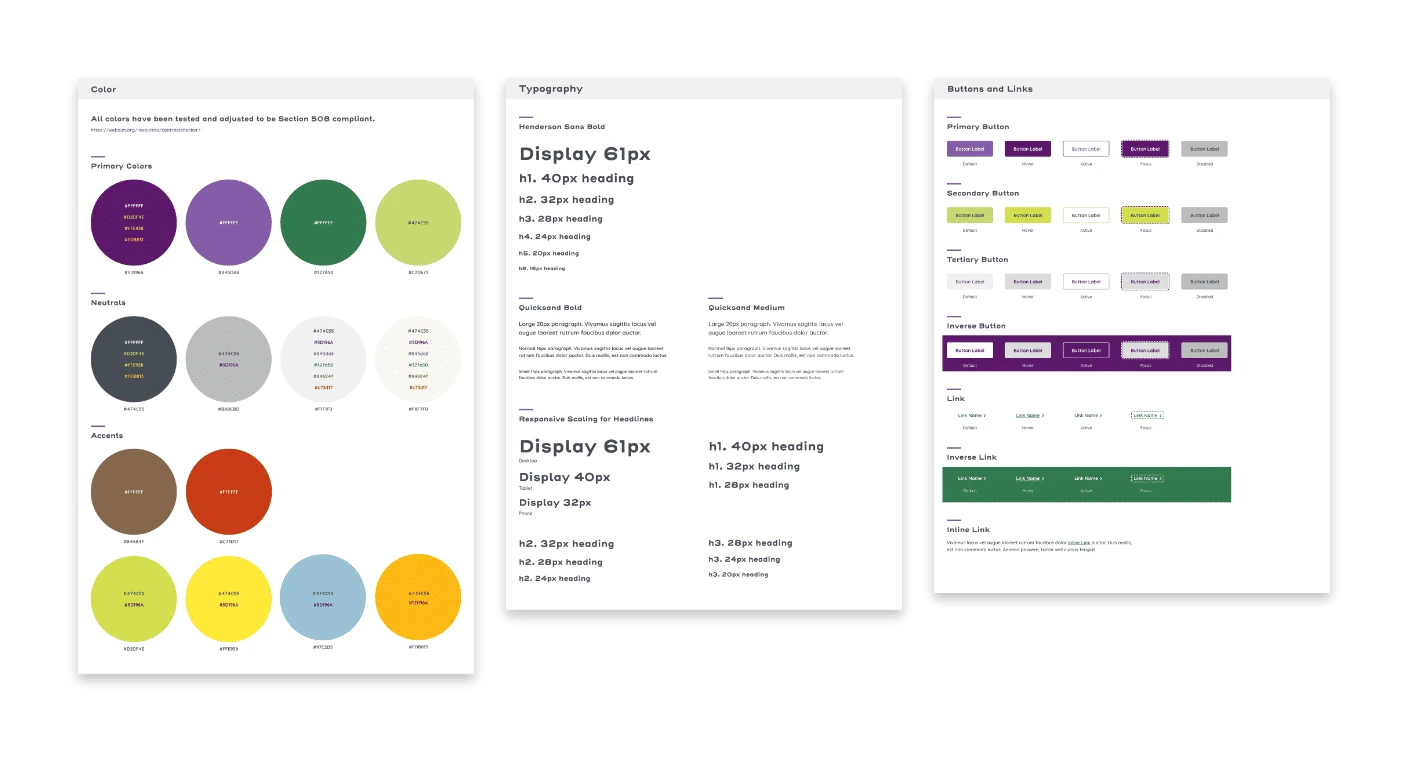
- Built one grid that works on any device
- Defined what the screen says back, so no one is left guessing
- Built accessibility into the foundation
Scalable component library
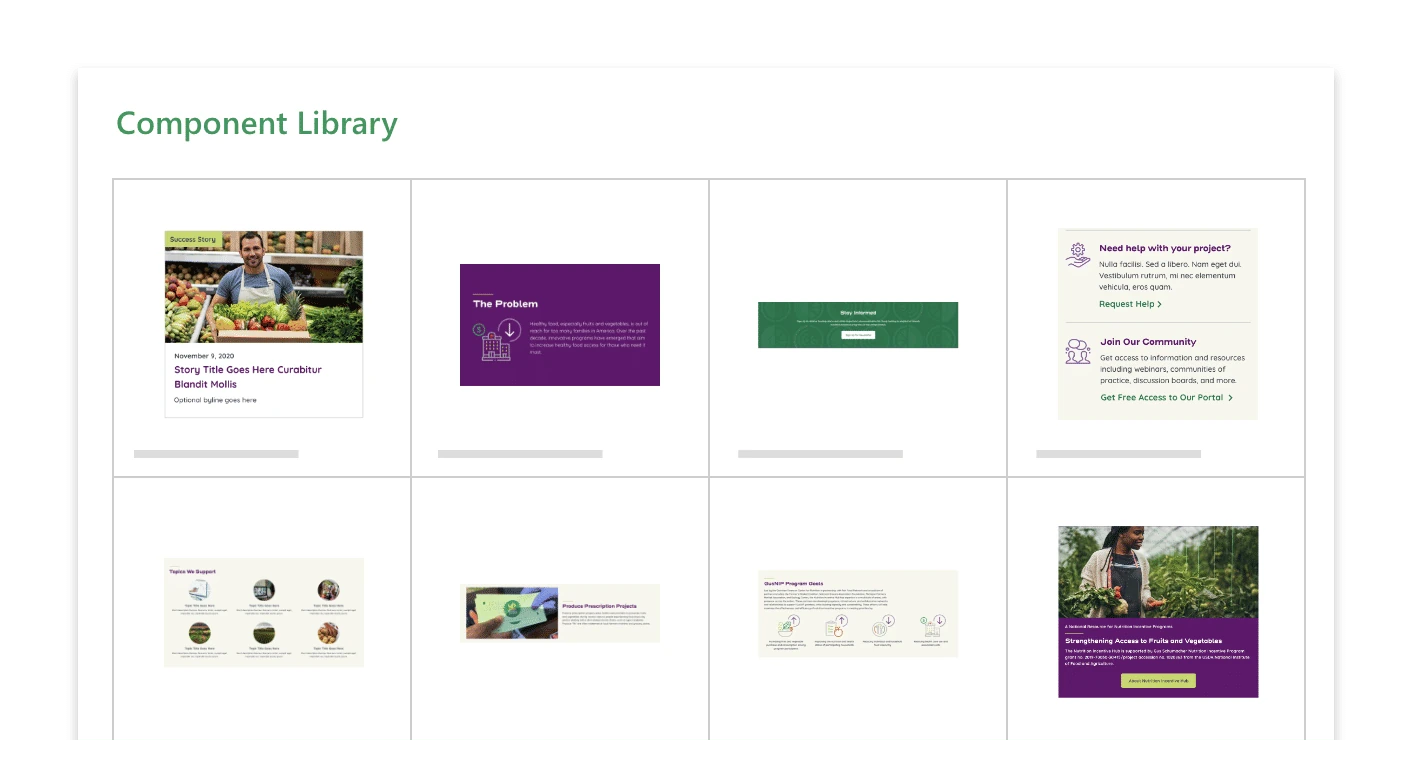
- One place designers and developers both work from
- Handed over specs ready to build
- Designed small components that combine into new screens
The impact
How I measured this
How each figure above was counted, over what period, and what it cannot tell you.
- 45–55 hours to just over 10
- The analysts’ logged time per data-analysis request: the range across a sample of requests before the platform, against the average once requests ran through the Power BI reports. Measured by the program team from their own time records.
- Validation time, roughly half
- Time spent checking and validating grantee submissions per reporting period, before and after validation moved into the forms. Fewer submission errors is the analysts’ observation. The error rate was not tracked the same way before, so it has no percentage.
- Grantees nearly doubled, no new analysts
- The grantee count at launch against the count after the platform had run a full reporting cycle. Analyst headcount over the same period did not change.
- 135+ grantees, 200,000+ page requests a week
- Read from the platform’s own analytics and database: counts, not estimates.
One platform carrying 135+ grantees and 200+ grants, at 200,000+ page requests a week. Administrators got their time back. Grantees could trust what they were reading. And the network finally had room to grow.